CRM
RFM Analysis for Catering: Find Your Real VIPs in 5 Minutes
Most catering operators think their VIPs are the customers who spend the most. They keep a list in their head: the law firm, the family that books big weddings, the corporate account that ordered $20,000 in November.
That list is wrong, or at least incomplete. Spend alone is a lagging indicator. The customer who spent $20K in November but has not ordered since January is not a VIP. They are a churn risk.
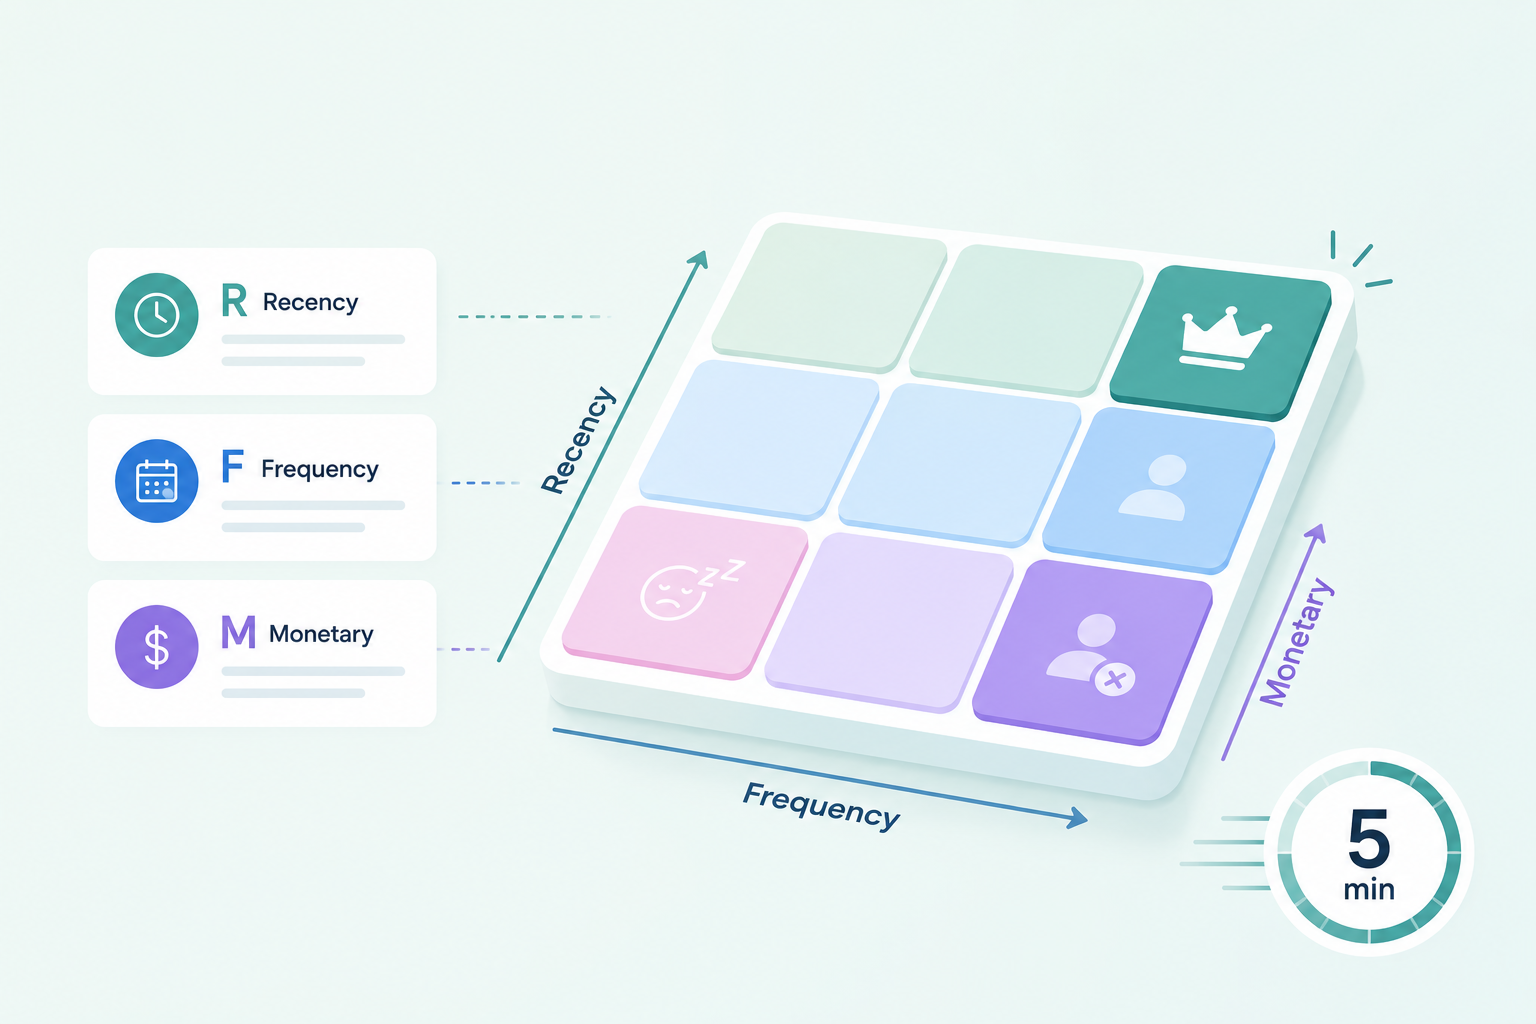
RFM (Recency, Frequency, Monetary) is the simplest and most reliable way to find your real VIPs and act on them. It takes 5 minutes once your CRM has data. This post explains exactly how.
What does RFM stand for and why does it matter?
Three dimensions, scored together:
- Recency: how recently did this customer order?
- Frequency: how often do they order in a defined window?
- Monetary: how much do they spend per order on average?
The insight: any one dimension alone is misleading. Together they describe the real customer pattern.
A customer with high M but low R is leaving. A customer with high F but low M might be a B2C customer who orders weekly and could be upsold to bigger orders. A customer with high R and F but low M is a true power user (maybe a small office, but they buy you constantly).
The full matrix is more honest than any single metric.
How do you score each dimension?
Three common approaches. Pick one and stay consistent.
1 to 5 quintile scoring (the standard)
For each dimension, rank all your customers from lowest to highest. Split into 5 buckets:
- 5 = top 20%
- 4 = next 20%
- 3 = middle 20%
- 2 = next 20%
- 1 = bottom 20%
Every customer gets a 3-digit score: 5-5-5 (top in all three), 1-1-1 (bottom in all three), or anything in between.
Absolute threshold scoring (simpler)
For Recency: 5 = ordered in last 30 days, 4 = 31 to 60 days, 3 = 61 to 90, 2 = 91 to 180, 1 = over 180 days.
For Frequency: 5 = 12+ orders/year, 4 = 8 to 11, 3 = 4 to 7, 2 = 2 to 3, 1 = 1.
For Monetary: 5 = average order $500+, 4 = $300 to $499, 3 = $150 to $299, 2 = $50 to $149, 1 = under $50.
Less statistically rigorous but easier to communicate.
Combined score (for triage)
Sum the three numbers. 15 = top of the pyramid. 3 = bottom. Most useful for prioritizing where to focus a limited team's effort.
What does the matrix tell you about each customer segment?
Five segments matter most.
Champions (R 4-5, F 4-5, M 4-5)
The top ~3 to 5 percent of customers. Order recently, often, and at high values. Treat like royalty: dedicated account manager, white-glove service, first access to new menus.
At-Risk Big Spenders (R 1-2, F 4-5, M 4-5)
Used to be Champions. Have stopped ordering recently. These are the most expensive customers to lose. Reactivation campaign within 7 days of crossing the recency threshold is mandatory.
Loyal Small (R 4-5, F 4-5, M 1-2)
Order constantly but at small values. Excellent upsell candidates: bigger packages, add-on items, premium tiers.
New Promising (R 5, F 1-2, M 3-5)
Recent first order at a healthy value. Have not built frequency yet. Drive frequency via follow-up and a second order incentive.
Lost (R 1, F 1, M any)
One order, never came back. Most are gone, but ~10 to 15 percent will return if you reach out with the right offer. Lapsed customer campaign.
What actions do you take for each segment?
| Segment | Action | Owner | |---|---|---| | Champions | Quarterly check-in call, custom menu, named account manager | Sales lead | | At-Risk Big Spenders | 48-hour reactivation outreach with personalized note + Amazon gift card | Account manager | | Loyal Small | Upsell campaign: premium packages, add-ons | Marketing | | New Promising | Follow-up + second-order incentive | Automated | | Lost | Quarterly reactivation campaign | Automated | | Bottom (1-1-1) | Do nothing. Focus elsewhere. | n/a |
The last row matters. RFM is also about NOT spending effort on the wrong customers.
How do you do this in 5 minutes?
Manually it takes an afternoon. In a CRM that supports RFM natively, it takes the time to open the report.
In AIA CRM, the RFM report is built in. You see all five segments with counts and dollar amounts. You filter to any segment and the customers are listed. You click any customer and see their full profile. Acting on the segment (sending a reactivation message, triggering an upsell campaign) is two more clicks.
If you do not have a CRM that does this, the alternative is to export your order data into a spreadsheet and use formulas. Doable, but the 5-minute version requires the data to live where the analysis runs.
Key takeaways
- Spend alone is a lagging indicator. RFM identifies the actual top customers and the risks.
- Score Recency, Frequency, Monetary in quintiles or absolute thresholds. Stay consistent.
- Five segments drive almost all decisions: Champions, At-Risk Big Spenders, Loyal Small, New Promising, Lost.
- At-Risk Big Spenders are the most expensive customers to lose. Reactivation must be inside 7 days of crossing the threshold.
- The bottom of the RFM pyramid should get the least effort, not equal effort.
If you want RFM analysis built into the CRM you already work in, walk through AIA.